Data Science for Impeachment Votes Prediction
1. Introduction
It is not new that Data Science is applied to the political context, but we can say that the 2008 US presidential elections were a watershed for Data Science in politics. Barack Obama’s campaign extensively used Data Science, mainly applied to social networks, to optimize the campaign and raise more funds, however, the big surprise of this election in this regard was a statistician Nate Silver who made predictions on his blog , FiveThirtyEight, and got the election results in 49 of the 50 states right.
Nate, who is the author of the book The Signal and the Noise: Why So Many Predictions Fail–but Some Don’t was also extremely fortunate in his 2012 US presidential election predictions and got the outcome of the elections in 50 of the 50 states. With that, the internet started making jokes based on Chuck Norris Facts and created the hashtag #NateSilverFacts.
After these facts, Data Science has been widely used in politics, even to the point of reaching series such as House of Cards, where we can see the character Aidan doing a sentiment analysis during a debate held between Underwood and Conway.
In the Brazilian context, we still see few initiatives in this direction, and given the uncertainties that precede the vote on the impeachment of President Dilma Rousseff, this article aims to use a Data Science approach to try to predict the result of the Impeachment vote.
2. Problem
The definition of our problem is: predicting the votes of the deputies in the opening vote on the impeachment of President Dilma Rousseff to be held in the Chamber of Deputies, that is, making a prediction of the Impeachment vote
In this case, impeachment is opened if two thirds (342) of the 513 deputies vote in favor, that is, the impeachment process is opened if 342 deputies or more vote in favor.
To better understand the entire impeachment process of President Dilma Rousseff, I suggest watching this special carried out by G1.
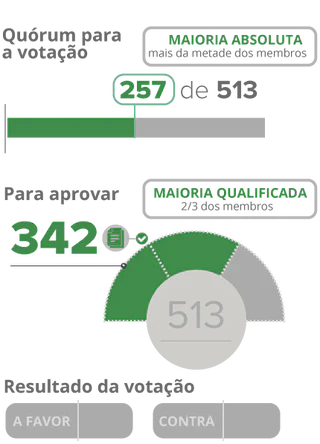
Source: G1
3. Data
To predict the votes of deputies, we will use the following information:
- Name of Deputy
- Party
- State
- Votes taken in the Chamber of Deputies in 2015
- Expression of Vote
3.1 Sources
This data was collected from the website of Mapa do Impeachment of Movimento Vem Pra Rua Brasil and Radar Parlamentar of Grupo de Estudos de Software Livre da POLI-USP.
Going into more detail, the data on Votes taken in the Chamber of Deputies in 2015 was obtained from Parliamentary Radar and the rest from Impeachment Map.
3.2 Preprocessing
It is important to note that there was work involved in obtaining, mainly in relation to the Votes taken in the Chamber of Deputies in 2015, where it was necessary to import the Parliamentary Radar Database (it took approximately 6 hours) in PostgreSQL, perform a database query to obtain the necessary data and then export this data in CSV format. The other part was facilitated by file available in Regis A. Ely’s post on impeachment
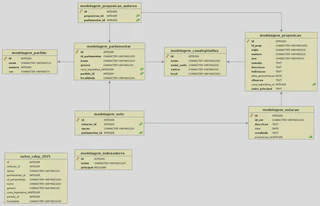
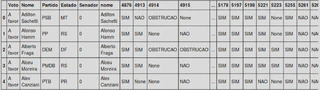
After exporting the query data, we have the following data:
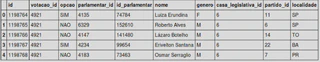
It is important to note that the voting data is in Long format and to adapt it for processing a model, we have to put it in Wide format. After converting Long to Wide, we have the following result:
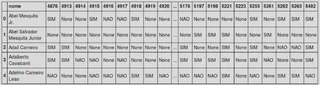
So, after conversion, the numbers in the columns refer to the votes_id and the votes in the rows.
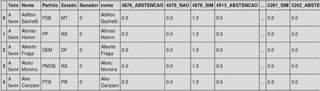
After that, I cross-referenced the database with Votes taken in the Chamber of Deputies in 2015 with the Impeachment Map database and arrived at this result:
As already shown in the previous table, the voting options can be:
- ABSTENTION
- OBSTRUCTION
- YES
- NO
- None (When there is no record of the deputy in that vote)
With this, we can see that in each vote we have a categorical variable and for our model to better understand the separation of categories we will carry out a Dummy Coding process where we will have a sparse matrix.
Furthermore, the variables Party and State are also categorical, therefore, we must do the same process with them.
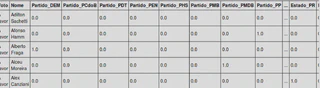
And so we arrive at the pre-processed database, with 513 lines and 888 columns (listed below):
- Name
- 26 Parties
- 27 States
- 833 in relation to the votes cast in the Chamber of Deputies in 2015
- Expression of Vote
4. Model
From the previous data stage, we can attest to the graph from Forbes article which says that a data scientist spends approximately 80% of their time preparing data.
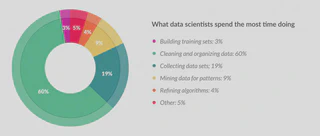
Source: Forbes
But let’s look on the bright side, we’ve reached the part that data scientists like most, which is applying algorithms to data, checking patterns and making predictions.
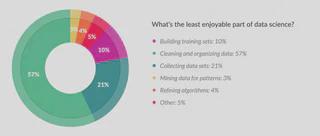
Source: Forbes
Well, now, before choosing which model we will apply, we need to define the metric that will define how satisfactory our model is.
4.1 Metric
In this case, our problem is binary classification (For or Against) and for this type of problem we have the following set of metrics that are commonly used:
- Accuracy Score
- Average Score
- F1 Score *Precision
- Recall *Log Loss
For the sake of simplicity, we will choose the Accuracy Score which is defined by the following formula:

4.2 Validation
Okay, now that we have the metric defined, let’s choose the cross-validation method to check the generalization of the model when predicting data that may be different from the training set, among the possibilities we have:
- KFold
- Stratified KFold
- Leave One Out
- Leave One Label Out
In this problem, we will use Stratified KFold, as it preserves the distribution of the Vote Expression in each partitioning, and we will also use 10 partitions to increase the degree of validation confidence.
4.3 Model Choice
Now, we come to the part of choosing the model, in this case, to make this type of choice we must take into account some aspects such as:
- Prediction Performance
- Computational Efficiency
- Interpretability
In this case, as our post values the reader’s understanding, we will choose a model that has good interpretability. Some models that meet this requirement are:
- Logistic Regression
- Decision tree
In this case, the Decision Tree model has more interpretability, therefore, this will be the model chosen.
4.4 Model Application
So, to recap we define the application of our model as follows:
- Metric: Accuracy Score
- Validation: Stratified KFold with 10 partitions
- Model: Decision Tree
Now, finally, we reach the model application stage, where we will use 383 deputies who voted for our training and validation set and 129 deputies who were undecided or who did not vote for our prediction set.
When applying our decision tree, I limited the depth to level 5 to facilitate interpretation and then arrived at the following results:
Cross Validation:
- 0.88 average accuracy
- 0.05 standard deviation
And one of the most interesting features of the Decision Tree is that we can see variables and their importance:
('5102_NAO', 0.48907282961971399), ('5166_NAO', 0.15440994106912861), ('5147_NAO', 0.077740704874052796), ('4999_NAO', 0.057152833759791341), ('5041_SIM', 0.052028491272337517), ('5085_SIM', 0.03781403149400113), ('Partido_PDT', 0.027263326073109304), ('Partido_PT', 0.02676308155800626), ('5109_NAO', 0.023867802734912871), ('5177_NAO', 0.022672717568444675), ('5032_SIM', 0.017145850127937404), ('4986_ABSTENCAO', 0.014068389848564032)
And this is the decision tree we arrived at:
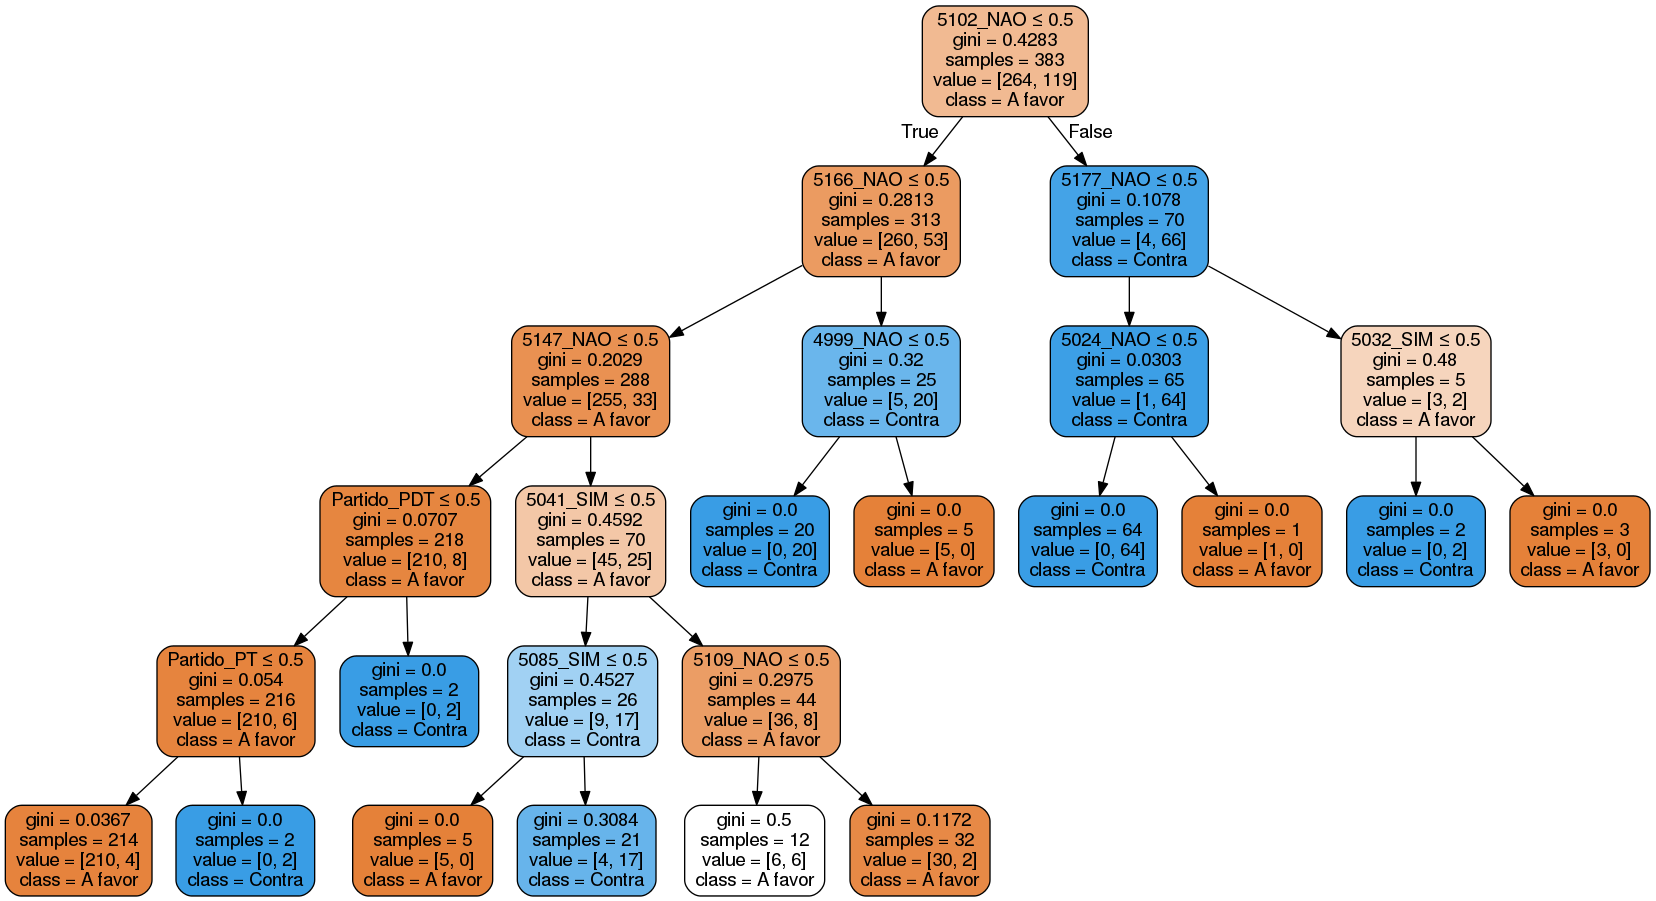
For you to understand better, let’s take for example, the root of our tree which has 5102_NAO <= 0.5, which basically says, if the deputy voted NO (NAO=1, YES=0) in vote 5102, he is probably against it. If he has not voted (NO=0, YES=0) or has voted YES (NO=0, YES=1) he is probably in favor.
Furthermore, follow the table below to make a parallel of the voting codes (see voting column). It is important to note that each project can have several votes and the vote can only refer to a part of the project, that is, a vote does not necessarily imply that a deputy is for or against the entire project.
| acronym | number | voting | voting_weight | description_vote | year |
|---|---|---|---|---|---|
| MPV | 661 | 5102 | 0.4890 | BNDES Confidentiality | 2014 |
| PL | 1057 | 5166 | 0.1544 | Infanticide | 2007 |
| MPV | 685 | 5147 | 0.0777 | PRORELIT | 2015 |
| PLP | 302 | 4999 | 0.0572 | Household | 2013 |
| PEC | 171 | 5041 | 0.0520 | Criminal Majority | 1993 |
| PL | 2960 | 5085 | 0.0378 | Repatriation | 2015 |
| MPV | 672 | 5109 | 0.0239 | Minimum Wage | 2015 |
| PL | 10 | 5177 | 0.0227 | Employee Life Insurance | 2015 |
| MPV | 665 | 5032 | 0.0171 | Fishermen Unemployment Insurance | 2014 |
| PEC | 443 | 4986 | 0.0141 | Increase for AGU and Delegates | 2009 |
As we can see, there are some controversial projects and this gives us proof and insight that checking votes on controversial projects can be a good indicator of how the deputy will vote on another controversial project, such as the impeachment vote.
5. Results
Finally, follow the results, with the voting predictions of the undecided voters and then the prediction considering the 513 deputies.
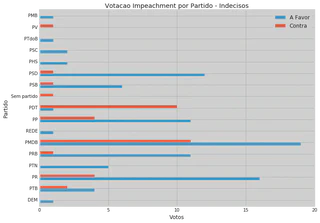
5.1 Undecided Vote Prediction
| Party | In Favor | Against |
|---|---|---|
| DEM | 1 | 0 |
| PDT | 1 | 10 |
| PHS | 2 | 0 |
| PMB | 1 | 0 |
| PMDB | 19 | 11 |
| PP | 11 | 4 |
| PR | 16 | 4 |
| PRB | 11 | 1 |
| PSB | 6 | 1 |
| PSC | 2 | 0 |
| PSD | 12 | 1 |
| PTB | 4 | 2 |
| PTN | 5 | 0 |
| PTdoB | 1 | 0 |
| PV | 0 | 1 |
| NETWORK | 1 | 0 |
| No party | 0 | 1 |
| Total | 93 | 36 |
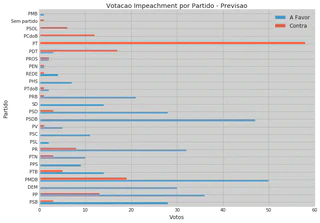
5.2 Vote Forecast
| Party | In Favor | Against |
|---|---|---|
| DEM | 30 | 0 |
| PCdoB | 0 | 12 |
| PDT | 3 | 17 |
| PEN | 1 | 1 |
| PHS | 7 | 0 |
| PMB | 1 | 0 |
| PMDB | 50 | 19 |
| PP | 36 | 13 |
| PPS | 9 | 0 |
| PR | 32 | 8 |
| PRB | 21 | 1 |
| PROS | 2 | 2 |
| PSB | 28 | 3 |
| PSC | 11 | 0 |
| PSD | 28 | 3 |
| PSDB | 47 | 0 |
| PSL | 2 | 0 |
| PSOL | 0 | 6 |
| PT | 0 | 58 |
| PTB | 14 | 5 |
| PTN | 10 | 3 |
| PTdoB | 2 | 1 |
| PV | 5 | 1 |
| NETWORK | 4 | 1 |
| SD | 14 | 0 |
| No party | 0 | 1 |
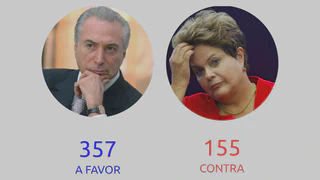
| Total | 357 | 155 |
According to our forecast, we will have 357 votes in favor and 155 votes against, therefore, this means that the forecast considers that the impeachment process will be opened.
Still, I believe it is possible to improve the forecast performance with other types of model or hyperparameterization and if I have time, I will publish a new forecast using another model with optimized parameters.
6. Thanks
I thank Bruna Ferreira dos Santos for reviewing this article and Leonardo Leite from Radar Parlamentar for her help with the Radar Parlamentar database.
